Our ongoing project at Glen Finglas has shown how sensitive biodiversity is to changing upland management. To maintain consistency, we have used the same monitoring methods since the beginning of the project. However, one of the benefits of long-term projects is that new technology emerges and can be incorporated to allow more detailed understanding to be developed.
We have employed drone-based multispectral imaging to develop a high-resolution map of the experiment that shows the amount of vegetation present. We have combined that with our routine mapping of bird territories to look at what drives nesting behaviour.
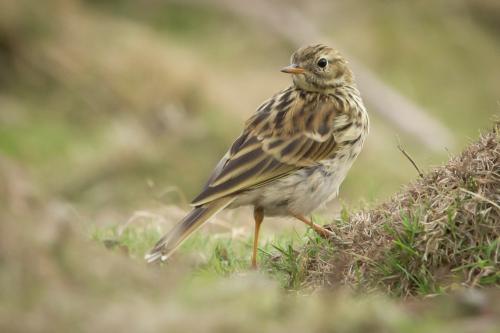
It appears that meadow pipits, the main nesting bird, have smaller territories where the grass is shorter and accessing prey is easier. In contrast territories are larger where there are lots of big tussock grasses and accessing prey is hard. Existing vegetation constrains how changes in livestock grazing pressure affect the birds as nesting density appears to be impacted by vegetation structure.
Stage
Directory of Expertise
Purpose
The Glen Finglas experiment was set up in 2002 to inform policy on the implications of changing the support system for upland farmers. In effect, how management changes might cascade through an ecosystem to affect many aspects of biodiversity. The information gathered from the experiment helps support the Scottish Government’s Biodiversity Strategy and developing agricultural support policies.
The vegetation is a mosaic of different communities including acid grasslands, wet grassland and wet heath (Image 1). We established four treatments, replicated six times with a plot size of 3.3 ha. The treatments were:
• Continued moderate sheep grazing (0.9 sheep ha-1),
• High sheep grazing, tripling the grazing to 2.7 sheep ha-1,
• Mixed cattle and sheep grazing with the same stocking at the continued treatment,
• No grazing.
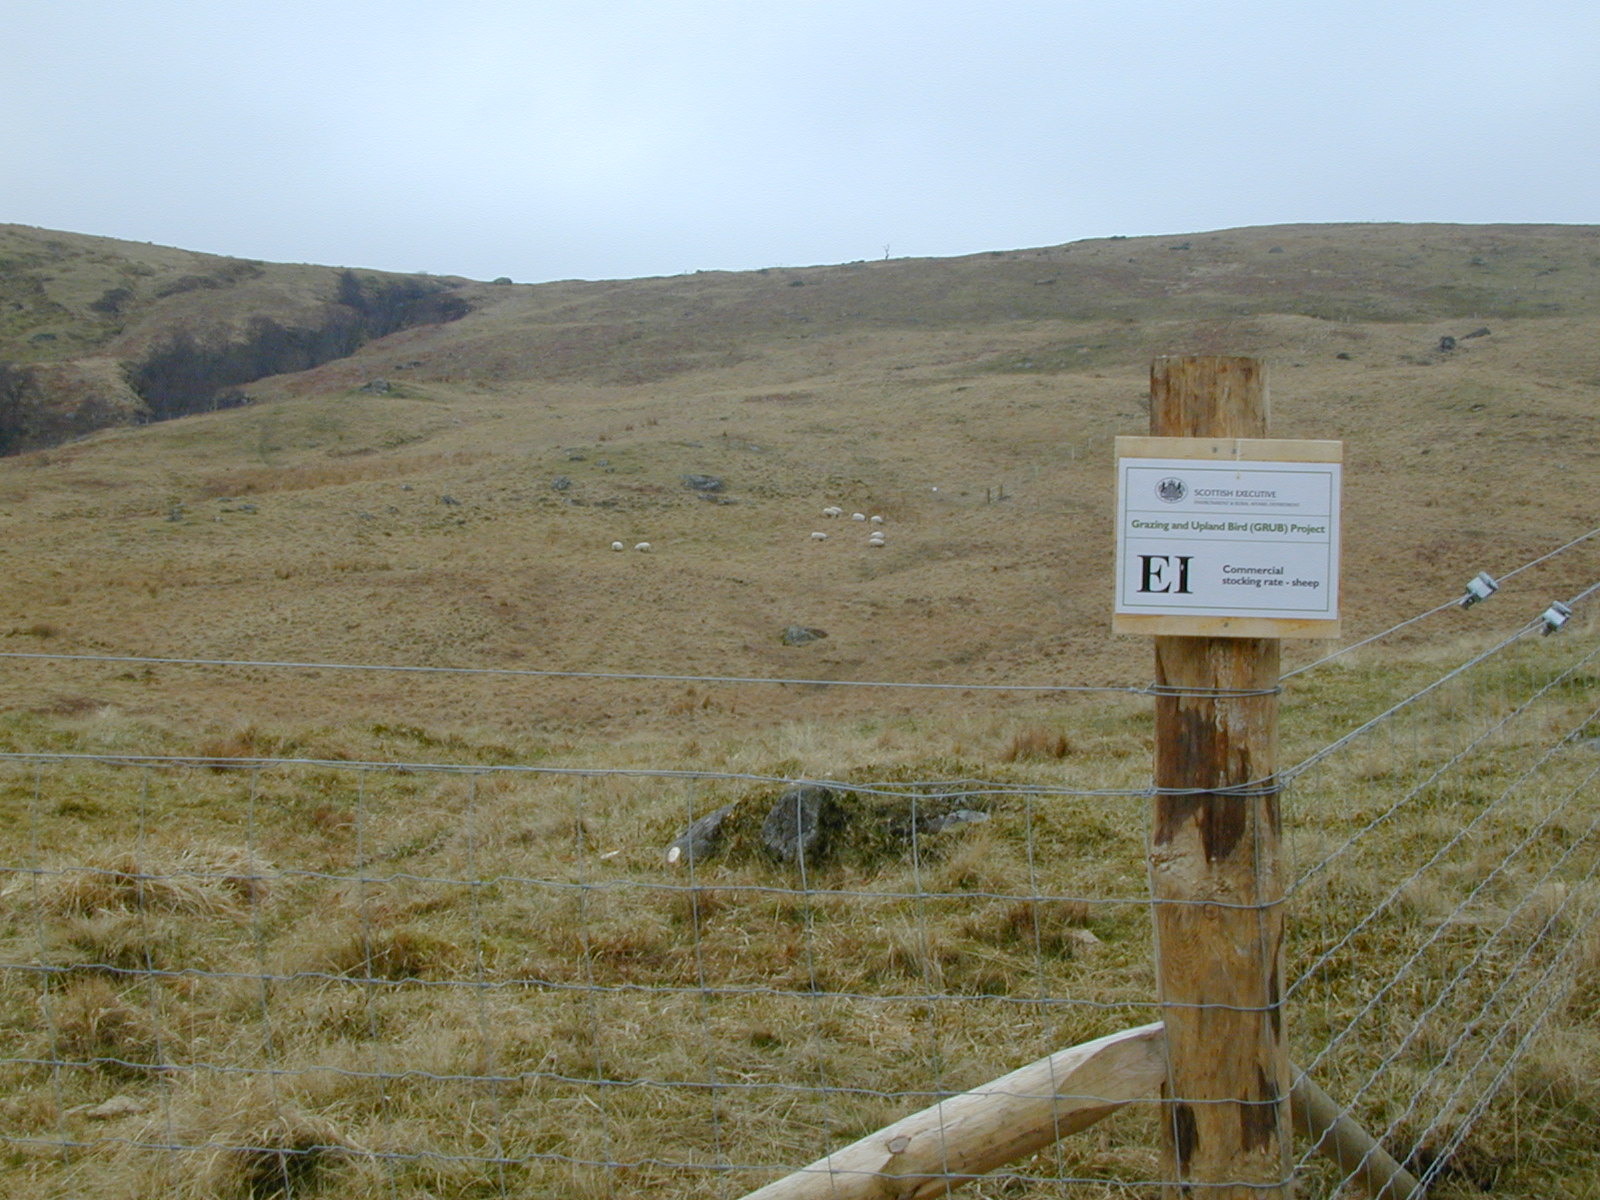
Image 1: A view of blocks E and F in the experiment from the south-east corner of plot EI looking north-west.
Bird densities have been recorded since the start of the experiment. They are monitored through developing territory maps from repeat visits through the spring. Previous analysis has shown that densities were higher at high stocking densities or where cattle were present, as the vegetation was broken up allowing the birds access to forage into more areas. However, this is only a plot level effect and more detailed understanding is needed to extrapolate effects beyond the experiment.
Drones are now widely and cheaply available and they can be equipped with relatively inexpensive sensors/cameras. We flew the field site in spring and autumn 2021 and were able to collect spectral data at a 7 cm resolution. Having a sensor in the red and one in the infra-red allowed us to calculate the Normalised Difference Vegetation Index (NDVI), a measure of how much green vegetation was present (Figure 1). Territory maps for 2021 were digitised and linked to the NDVI data.
Results
Comfortingly, the plot level averages of autumn measured NDVI were lower for the more heavily grazed treatment and higher for the treatment without livestock grazing. Also, there were strong positive correlations between Autumn NDVI and vegetation heights measured at both the plot scale and around each point where the vegetation height was measured in the autumn. Interestingly, there was a strong negative correlation between Spring NDVI with vegetation height; there are lower values of spring biomass where there were higher values in the autumn as the dominant tussock forming species, purple moor grass (Molinia caerulea) dies back in the autumn.
Larger apparent meadow pipit territories had, on average, higher values of NDVI in autumn, larger differences between autumn and spring measures of NDVI and lower values of spring NDVI. All relationships explained only a small fraction of the variation in apparent territory size, maximum 4.7 %. Though the relationships are weak, it shows that drone based remote sensing could be a useful method going forward, especially if linked through to more precise measures of territory use.
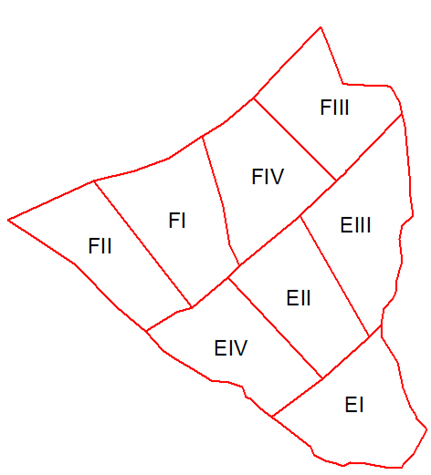
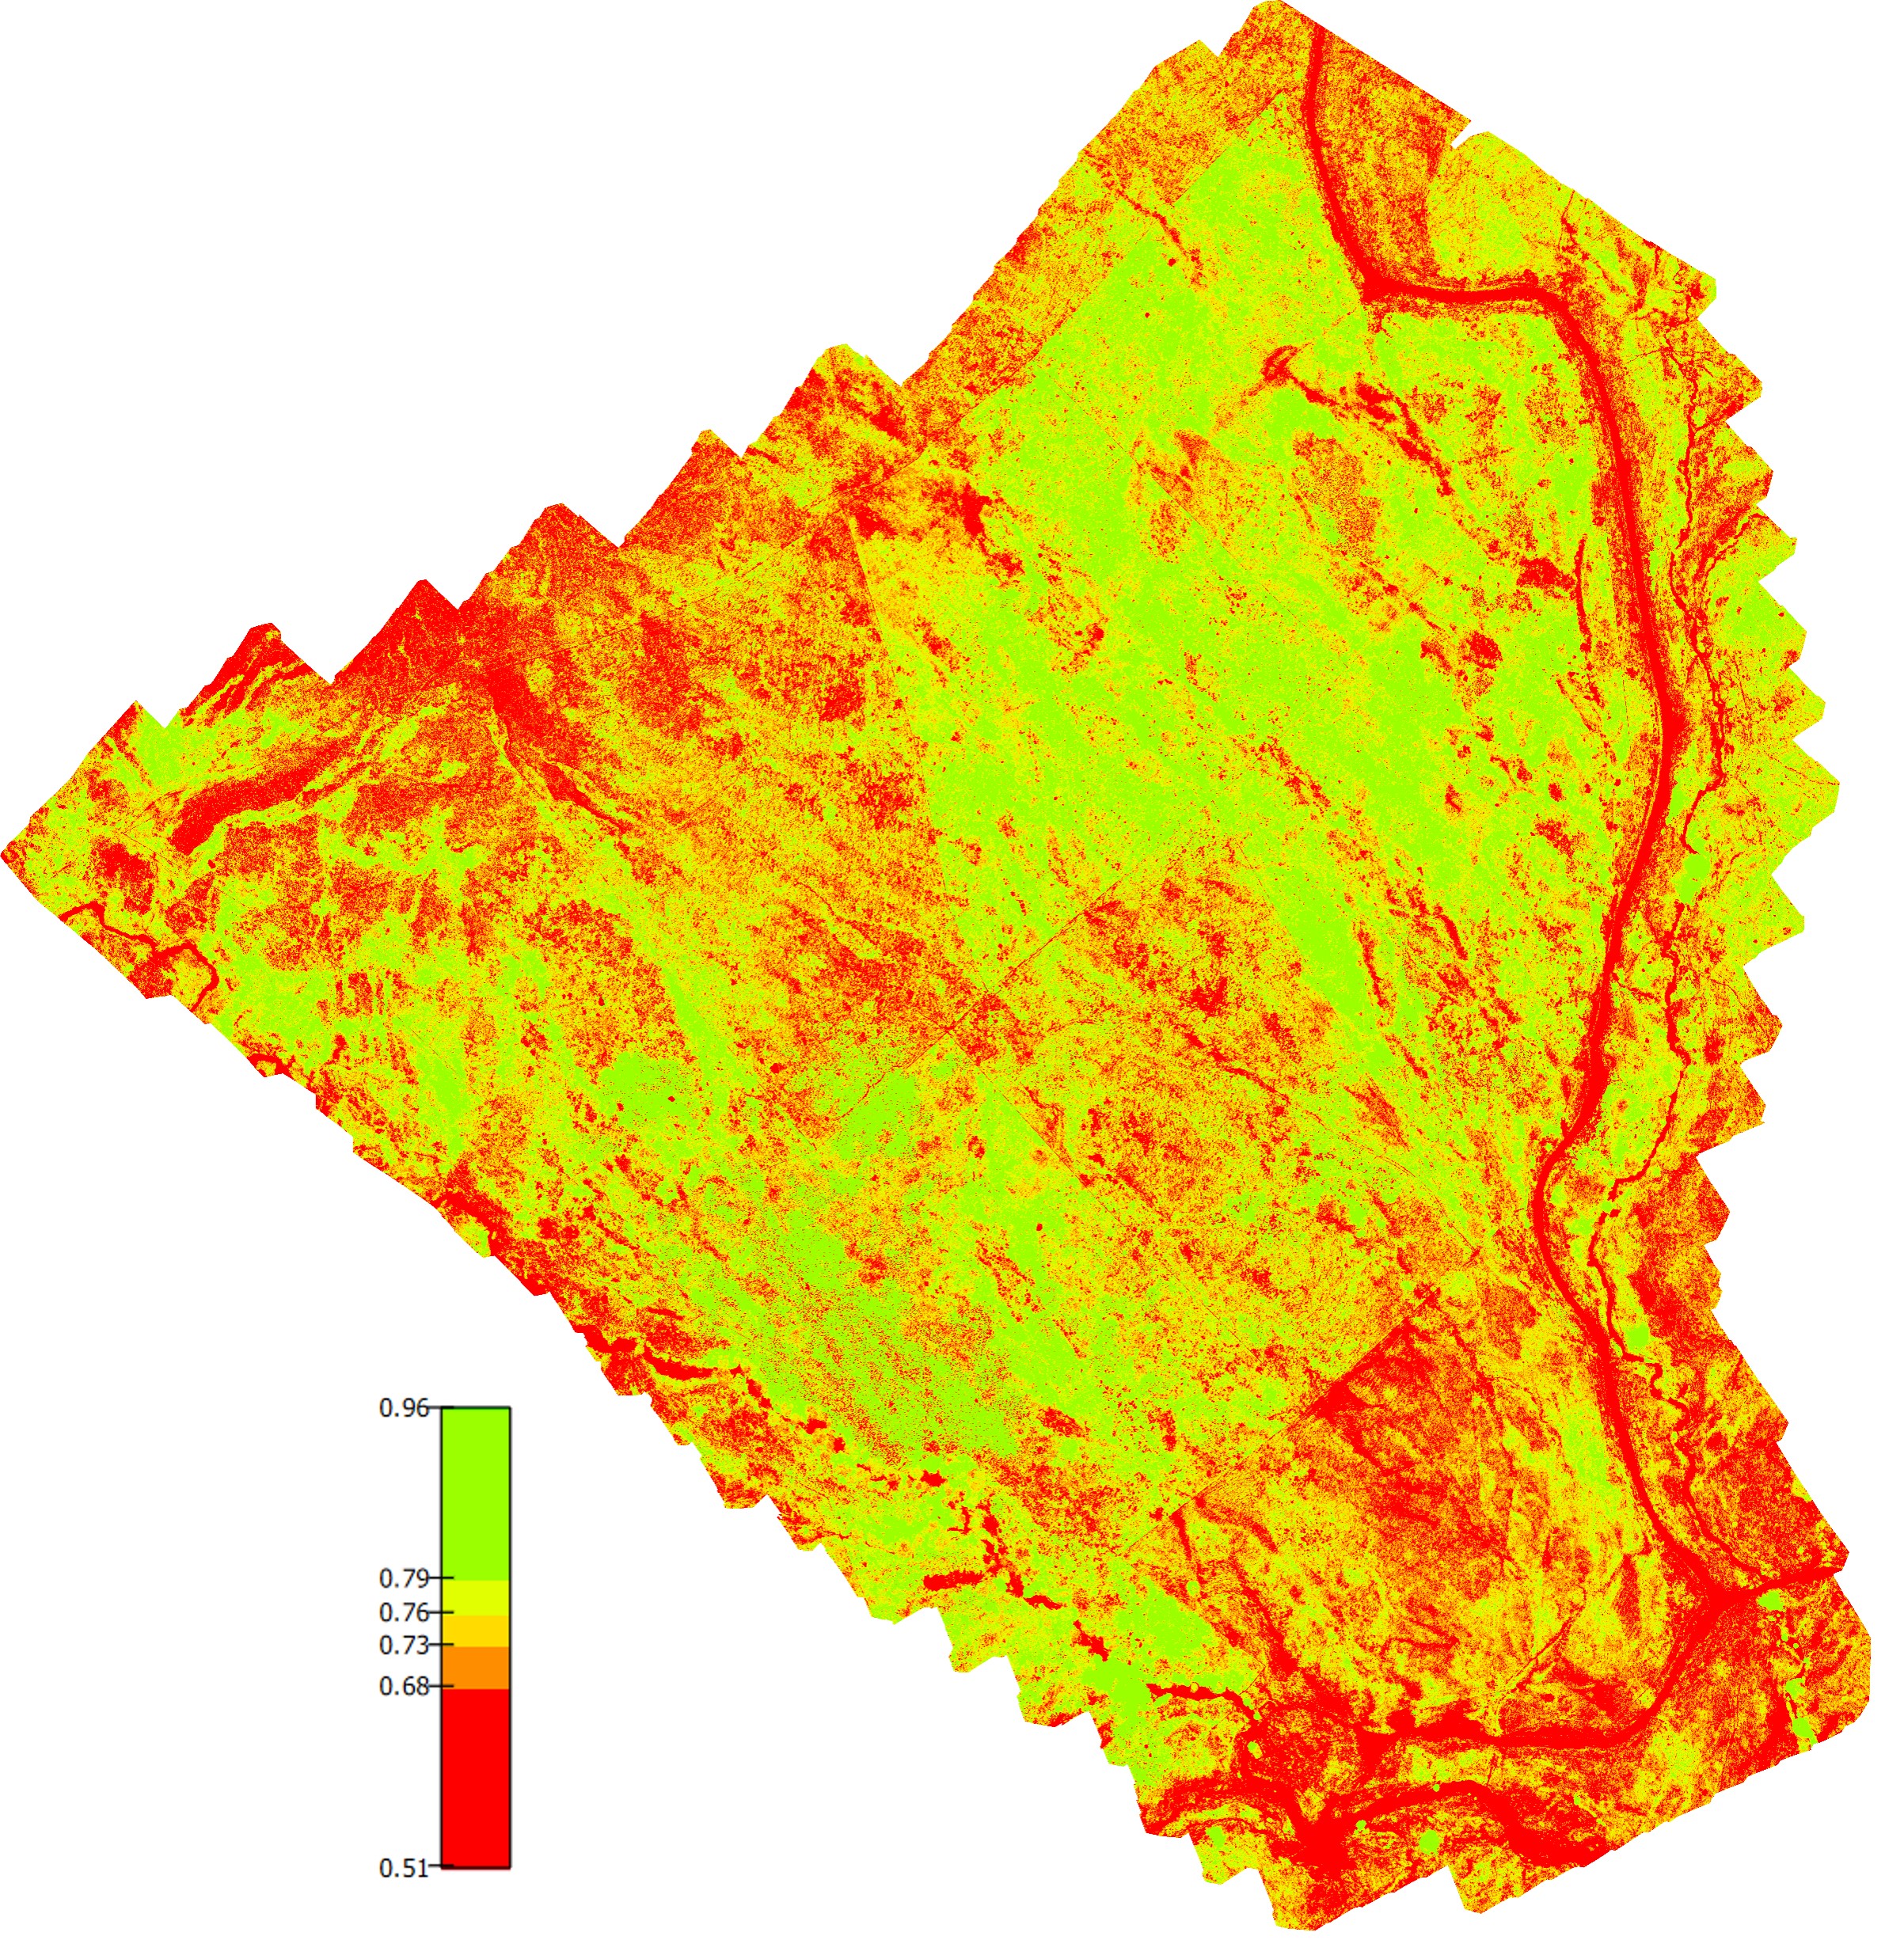
Figure 1, Left panel: Plot boundaries for Blocks E and F. I. High sheep grazing (2.7 sheep ha-1), II. Continued moderate sheep grazing (0.9 sheep ha-1), III. Mixed cattle and sheep grazing with the same stocking at the continued treatment, IV. No grazing. Right panel: Autumn Normalised Difference Vegetation Index. The red areas to the left and bottom are the heavily grazed plots, the winding red area to the right is the track along the east edge of the plots.
Benefits
The long-term, large-scale Glen Finglas experiment continues to deliver new insights into the ecology of the uplands and the cascading impacts of management change on biodiversity. New technology allows for new data to be collected, but the combination of this new data with routine monitoring in a long-term study allowed us to investigate at a whole new level of detail.
The results show that the impacts of management decisions, and ultimately policy decisions on agricultural support, may be buffered by the existing vegetation structure. This depends on the presence or absence of large tussock-forming species like purple moor grass which in turn depends on the wetness of the soil and the centuries of grazing management which has formed the vegetation mosaic present in Glen Finglas. This knowledge will help predict what might happen to biodiversity as upland policies continue to develop.
Project Partners
University of Newcastle
Dunnock Ecology
Lead Image: Meadow Pipit (Photo Credit: Paul Cooper - with permission)